Bullseye
Highlights
Relative Strength
Building a Winning Team
S
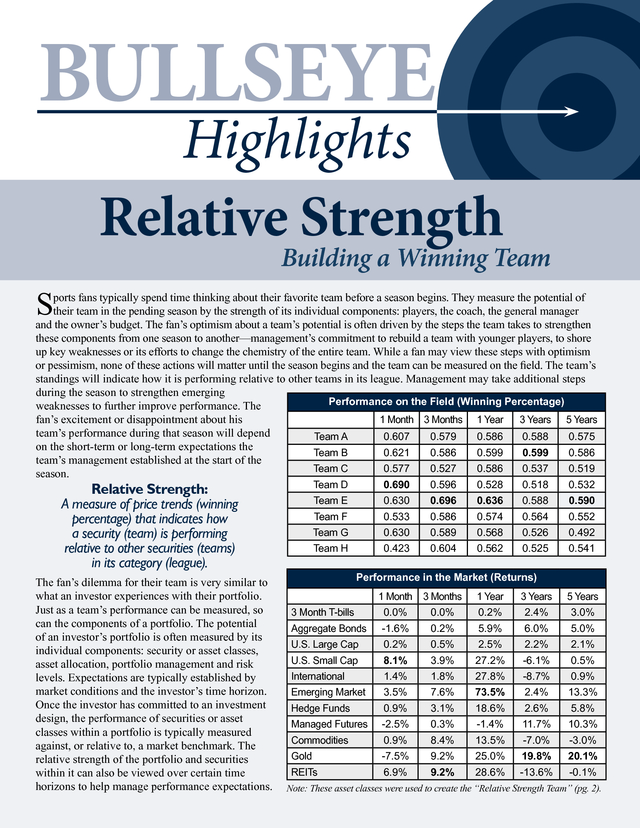
ports fans typically spend time thinking about their favorite team before a season begins. They measure the potential of
their team in the pending season by the strength of its individual components: players, the coach, the general manager
and the owner’s budget. The fan’s optimism about a team’s potential is often driven by the steps the team takes to strengthen
these components from one season to another—management’s commitment to rebuild a team with younger players, to shore
up key weaknesses or its efforts to change the chemistry of the entire team. While a fan may view these steps with optimism
or pessimism, none of these actions will matter until the season begins and the team can be measured on the field.
The team’s
standings will indicate how it is performing relative to other teams in its league. Management may take additional steps
during the season to strengthen emerging
Performance on the Field (Winning Percentage)
weaknesses to further improve performance. The
fan’s excitement or disappointment about his
1 Month 3 Months 1 Year
3 Years 5 Years
team’s performance during that season will depend
Team A
0.607
0.579
0.586
0.588
0.575
on the short-term or long-term expectations the
Team B
0.621
0.586
0.599
0.599
0.586
team’s management established at the start of the
Team C
0.577
0.527
0.586
0.537
0.519
season.
Team D
The fan’s dilemma for their team is very similar to
what an investor experiences with their portfolio.
Just as a team’s performance can be measured, so
can the components of a portfolio.
The potential
of an investor’s portfolio is often measured by its
individual components: security or asset classes,
asset allocation, portfolio management and risk
levels. Expectations are typically established by
market conditions and the investor’s time horizon.
Once the investor has committed to an investment
design, the performance of securities or asset
classes within a portfolio is typically measured
against, or relative to, a market benchmark. The
relative strength of the portfolio and securities
within it can also be viewed over certain time
horizons to help manage performance expectations.
0.690
0.596
0.528
0.518
0.532
Team E
0.630
0.696
0.636
0.588
0.590
Team F
0.533
0.586
0.574
0.564
0.552
Team G
0.630
0.589
0.568
0.526
0.492
Team H
Relative Strength:
A measure of price trends (winning
percentage) that indicates how
a security (team) is performing
relative to other securities (teams)
in its category (league).
0.423
0.604
0.562
0.525
0.541
Performance in the Market (Returns)
1 Month
3 Months
1 Year
3 Years
5 Years
3 Month T-bills
0.0%
0.0%
0.2%
2.4%
3.0%
Aggregate Bonds
-1.6%
0.2%
5.9%
6.0%
5.0%
U.S.
Large Cap
0.2%
0.5%
2.5%
2.2%
2.1%
U.S. Small Cap
8.1%
3.9%
27.2%
-6.1%
0.5%
International
1.4%
1.8%
27.8%
-8.7%
0.9%
Emerging Market
3.5%
7.6%
73.5%
2.4%
13.3%
Hedge Funds
0.9%
3.1%
18.6%
2.6%
5.8%
Managed Futures
-2.5%
0.3%
-1.4%
11.7%
10.3%
Commodities
0.9%
8.4%
13.5%
-7.0%
-3.0%
Gold
-7.5%
9.2%
25.0%
19.8%
20.1%
REITs
6.9%
9.2%
28.6%
-13.6%
-0.1%
Note: These asset classes were used to create the “Relative Strength Team” (pg. 2).
�.
A Management Tool
In a sports tournament, a team’s ultimate goal is to win. Similar to a team’s management, a portfolio manager may increase
or decrease allocations to existing positions and constantly monitor different asset classes to identify emerging trends.
Likewise, a relative strength portfolio manager uses a tournament approach to narrow a portfolio to a group of the strongest
securities. In the first round of the tournament, securities are grouped and compared by within their asset class to identify
the top-performing representatives. In the second round, relative strength is used to compare the strength of each asset class
to allocate larger (strong relative strength) and smaller (weak relative strength) positions to these asset classes within the
short, intermediate or long-term measurements
U.S.
Equities
International
either individually or combined, and they
Relative Strength
Developed:
Large Cap Growth
can run this test as frequently as they deem
Australia France
Large Cap Value
Tournament
Germany Italy
necessary.
Mid Cap Growth
Relative Strength Tournament
Mid Cap Value
Small Cap Growth
Small Cap Value
Sectors:
-Consumer Goods
-Financial Services
-Health Care ...etc.
Performance in the Market Returns1
60/40
Benchmark
Relative
Strength Team
1 Month
0.50%
2.50%
3 Months
3.70%
8.00%
1 Year
18.00%
12.50%
3 Years
-0.10%
8.60%
5 Years
2.90%
13.00%
Japan
U.K.
Emerging:
Brazil
China
Isreal
India
Mexico S. Africa
S.Korea Taiwan
Thailand ...etc.
The Final
Portfolio
Fixed Income
Alternatives
Commodities:
-Aggregated
-Agriculture
-Energy
-Industrial Metals
-Precious Metals
-Softs
Currencies
REITs
TIPS
Corporate Bonds:
-Short Term
-Intermediate
-Long Term
-High Yeild
U.S. Teasuries:
-T-Bills
-Treasury Notes
-Govt.
Bonds
Govt. Agencies
Relative Strength Team: The top asset classes
in the market performance table (pg. 1) using a
combination of applicable indexes measured by
intermediate- to long-term relative strength.
A Long-term Focus
It’s quite rare to see a sports team repeat as champions year after year.
Likewise, an investor’s portfolio doesn’t lead the market
year after year. A manager who relies on relative strength to identify portfolio positions will occasionally underperform the
market when trends are dramatically changing—the security market is cyclical and sometimes the relative strength measurement
period may not align with those short-terms changes.
Historically, there tend to be periods
of underperformance of relative
strength investing followed by periods
of strong outperformance. The
disciplined relative strength approach
helps investors identify and combine
the strongest securities, building a
winning team over the long term.
Relative Strength Team vs.
Market Benchmark
35.0%
30.0%
25.0%
20.0%
15.0%
10.0%
5.0%
0.0%
-5.0%
Rolling Averages
-10.0%
1 Year
3 Years
5
-9
3
ec
-9
6
D
ec
-9
7
D
ec
-9
8
D
ec
-9
9
D
ec
-0
0
D
ec
-0
1
D
ec
-0
2
D
ec
-0
3
D
ec
-0
4
D
ec
-0
5
D
ec
-0
6
D
ec
-0
7
D
ec
-0
8
D
ec
-0
9
D
ec
D
-9
ec
-9
4
D
D
ec
-9
2
1
-9
ec
D
ec
D
-9
ec
D
ec
-8
0
9
-15.0%
D
The chart to the right
illustrates the annualized
performance difference of a
relative strength approach
versus a 60/40 market
benchmark over one- and
three-year holding periods.
Past performance is not indicative of future returns. Historical data is used for statistical illustration purposes only
and should not be used as a predictive measure for the future return expectations of any investment. The information
provided is intended to be general in nature and should not be construed as investment advice.
The information is subject to change
(based on market fluctuation and other conditions) and should not be construed as a recommendation of any specific security or
investment product. It was prepared without regard for specific circumstances and objectives of any individual investor. The 60/40
Market Benchmark is 60% S&P 500 Index and 40% Barclays Aggregate Bond Index.
Data source: Morningstar/Ibbotson and Bloomberg
as of 12/31/2009. Northern Lights Distributors, LLC, member FINRA.
0392-NLD-3/23/2010
�.