ENVIRONMENTAL, SOCIAL AND
GOVERNANCE (ESG) SURVEY
CFA Institute
June 2015
�. TABLE OF CONTENTS
About The Survey
03
Survey Results
04
Respondent Profile
17
Appendix: Data Tables & Comments
20
2
�. ABOUT THE SURVEY
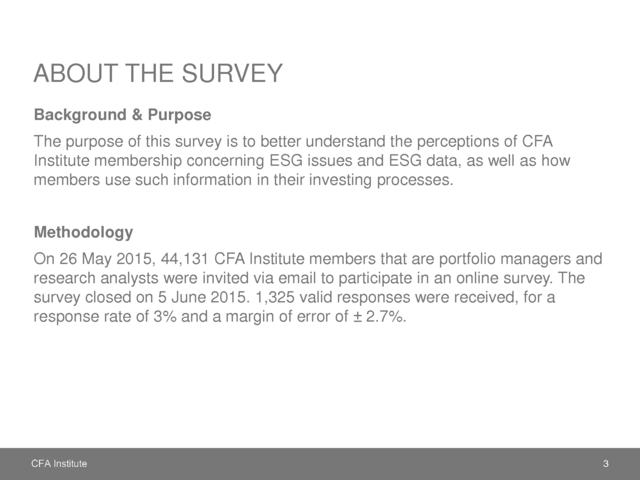
Background & Purpose
The purpose of this survey is to better understand the perceptions of CFA
Institute membership concerning ESG issues and ESG data, as well as how
members use such information in their investing processes.
Methodology
On 26 May 2015, 44,131 CFA Institute members that are portfolio managers and
research analysts were invited via email to participate in an online survey. The
survey closed on 5 June 2015. 1,325 valid responses were received, for a
response rate of 3% and a margin of error of ± 2.7%.
3
�. SURVEY RESULTS
4
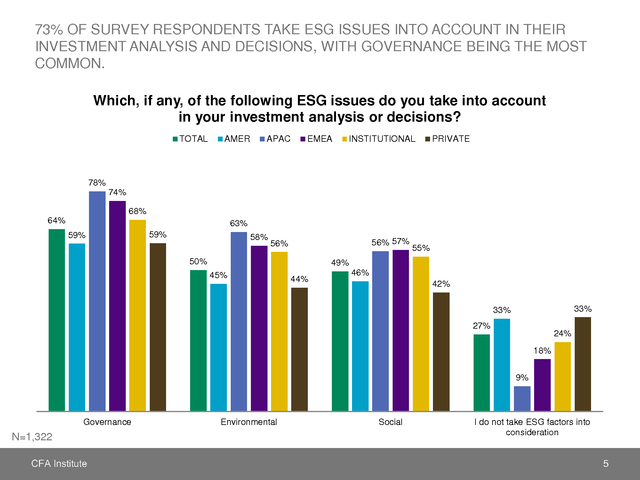
�. 73% OF SURVEY RESPONDENTS TAKE ESG ISSUES INTO ACCOUNT IN THEIR
INVESTMENT ANALYSIS AND DECISIONS, WITH GOVERNANCE BEING THE MOST
COMMON.
Which, if any, of the following ESG issues do you take into account
in your investment analysis or decisions?
TOTAL
AMER
APAC
EMEA
INSTITUTIONAL
PRIVATE
78%
74%
68%
64%
63%
59%
59%
58%
56% 57%
56%
50%
55%
49%
45%
44%
46%
42%
33%
33%
27%
24%
18%
9%
Governance
N=1,322
Environmental
Social
I do not take ESG factors into
consideration
5
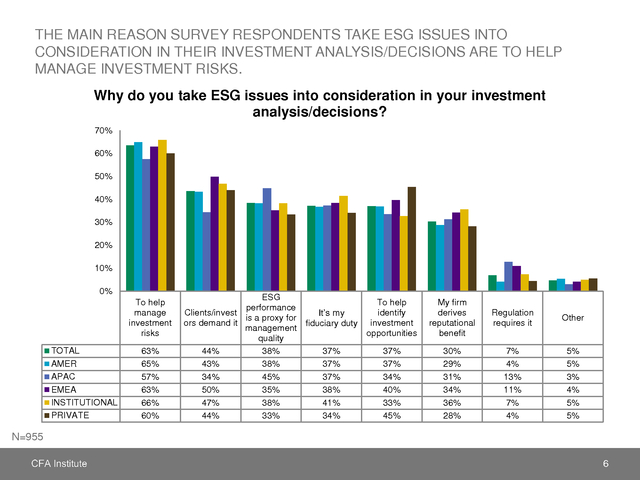
�. THE MAIN REASON SURVEY RESPONDENTS TAKE ESG ISSUES INTO
CONSIDERATION IN THEIR INVESTMENT ANALYSIS/DECISIONS ARE TO HELP
MANAGE INVESTMENT RISKS.
Why do you take ESG issues into consideration in your investment
analysis/decisions?
70%
60%
50%
40%
30%
20%
10%
0%
To help
manage
investment
risks
TOTAL
AMER
APAC
EMEA
INSTITUTIONAL
PRIVATE
63%
65%
57%
63%
66%
60%
ESG
To help
performance
Clients/invest
identify
It’s my
is a proxy for
ors demand it
fiduciary duty investment
management
opportunities
quality
44%
38%
37%
37%
43%
38%
37%
37%
34%
45%
37%
34%
50%
35%
38%
40%
47%
38%
41%
33%
44%
33%
34%
45%
My firm
derives
reputational
benefit
Regulation
requires it
Other
30%
29%
31%
34%
36%
28%
7%
4%
13%
11%
7%
4%
5%
5%
3%
4%
5%
5%
N=955
6
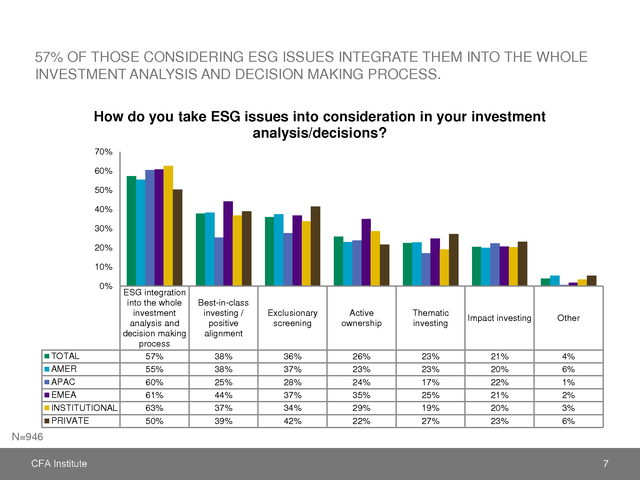
�. 57% OF THOSE CONSIDERING ESG ISSUES INTEGRATE THEM INTO THE WHOLE
INVESTMENT ANALYSIS AND DECISION MAKING PROCESS.
How do you take ESG issues into consideration in your investment
analysis/decisions?
70%
60%
50%
40%
30%
20%
10%
0%
ESG integration
into the whole
investment
analysis and
decision making
process
TOTAL
57%
AMER
55%
APAC
60%
EMEA
61%
INSTITUTIONAL
63%
PRIVATE
50%
Best-in-class
investing /
positive
alignment
Exclusionary
screening
Active
ownership
Thematic
investing
Impact investing
Other
38%
38%
25%
44%
37%
39%
36%
37%
28%
37%
34%
42%
26%
23%
24%
35%
29%
22%
23%
23%
17%
25%
19%
27%
21%
20%
22%
21%
20%
23%
4%
6%
1%
2%
3%
6%
N=946
7
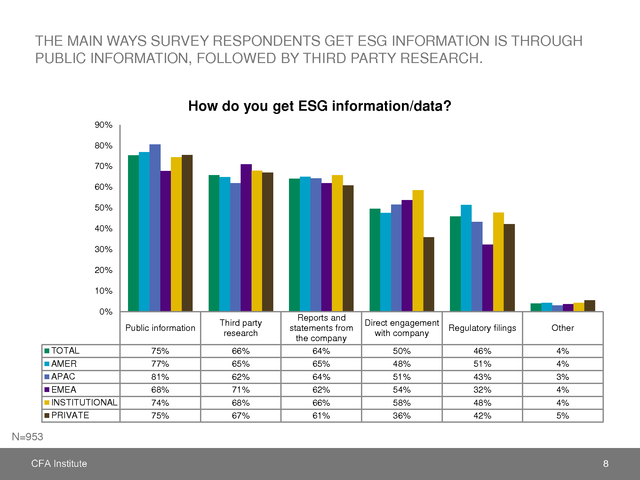
�. THE MAIN WAYS SURVEY RESPONDENTS GET ESG INFORMATION IS THROUGH
PUBLIC INFORMATION, FOLLOWED BY THIRD PARTY RESEARCH.
How do you get ESG information/data?
90%
80%
70%
60%
50%
40%
30%
20%
10%
0%
Public information
TOTAL
AMER
APAC
EMEA
INSTITUTIONAL
PRIVATE
Third party
research
75%
77%
81%
68%
74%
75%
66%
65%
62%
71%
68%
67%
Reports and
statements from
the company
64%
65%
64%
62%
66%
61%
Direct engagement
with company
Regulatory filings
Other
50%
48%
51%
54%
58%
36%
46%
51%
43%
32%
48%
42%
4%
4%
3%
4%
4%
5%
N=953
8
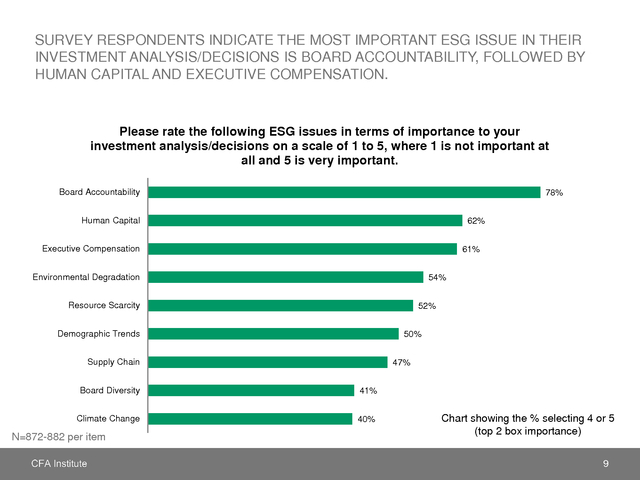
�. SURVEY RESPONDENTS INDICATE THE MOST IMPORTANT ESG ISSUE IN THEIR
INVESTMENT ANALYSIS/DECISIONS IS BOARD ACCOUNTABILITY, FOLLOWED BY
HUMAN CAPITAL AND EXECUTIVE COMPENSATION.
Please rate the following ESG issues in terms of importance to your
investment analysis/decisions on a scale of 1 to 5, where 1 is not important at
all and 5 is very important.
Board Accountability
78%
Human Capital
62%
Executive Compensation
61%
Environmental Degradation
54%
Resource Scarcity
52%
Demographic Trends
50%
Supply Chain
47%
Board Diversity
41%
Climate Change
40%
N=872-882 per item
Chart showing the % selecting 4 or 5
(top 2 box importance)
9
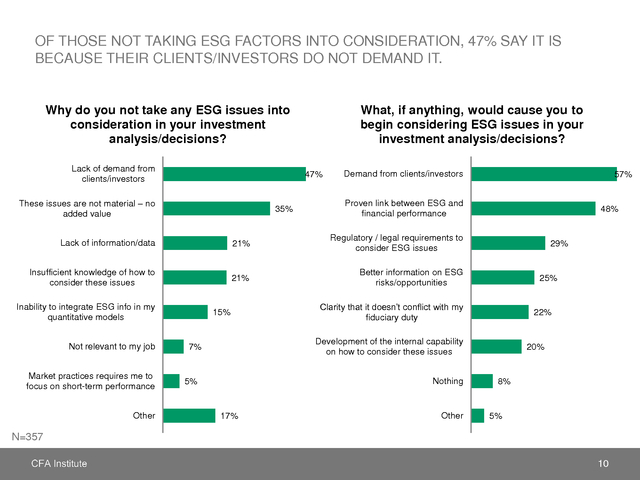
�. OF THOSE NOT TAKING ESG FACTORS INTO CONSIDERATION, 47% SAY IT IS
BECAUSE THEIR CLIENTS/INVESTORS DO NOT DEMAND IT.
Why do you not take any ESG issues into
consideration in your investment
analysis/decisions?
Lack of demand from
clients/investors
What, if anything, would cause you to
begin considering ESG issues in your
investment analysis/decisions?
47%
These issues are not material – no
added value
35%
Demand from clients/investors
57%
Proven link between ESG and
financial performance
Lack of information/data
21%
Regulatory / legal requirements to
consider ESG issues
Insufficient knowledge of how to
consider these issues
21%
48%
Better information on ESG
risks/opportunities
Inability to integrate ESG info in my
quantitative models
Not relevant to my job
Market practices requires me to
focus on short-term performance
Other
15%
29%
25%
Clarity that it doesn’t conflict with my
fiduciary duty
22%
Development of the internal capability
on how to consider these issues
7%
Nothing
5%
17%
Other
20%
8%
5%
N=357
10
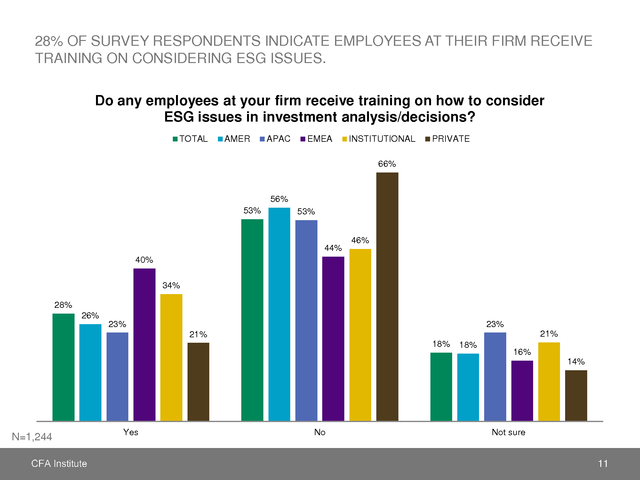
�. 28% OF SURVEY RESPONDENTS INDICATE EMPLOYEES AT THEIR FIRM RECEIVE
TRAINING ON CONSIDERING ESG ISSUES.
Do any employees at your firm receive training on how to consider
ESG issues in investment analysis/decisions?
TOTAL
AMER
APAC
EMEA
INSTITUTIONAL
PRIVATE
66%
56%
53%
53%
44%
46%
40%
34%
28%
26%
23%
23%
21%
21%
18%
18%
16%
14%
N=1,244
Yes
No
Not sure
11
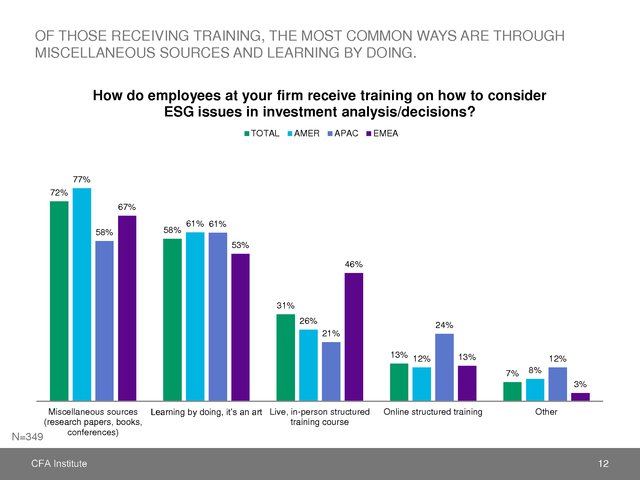
�. OF THOSE RECEIVING TRAINING, THE MOST COMMON WAYS ARE THROUGH
MISCELLANEOUS SOURCES AND LEARNING BY DOING.
How do employees at your firm receive training on how to consider
ESG issues in investment analysis/decisions?
TOTAL
AMER
APAC
EMEA
77%
72%
67%
58%
58%
61% 61%
53%
46%
31%
26%
24%
21%
13% 12%
13%
12%
7%
8%
3%
N=349
Miscellaneous sources Learning by doing, it’s an art Live, in-person structured
(research papers, books,
training course
conferences)
Online structured training
Other
12
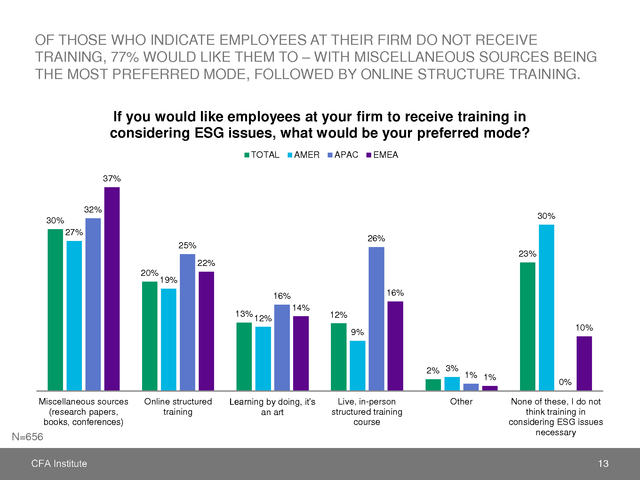
�. OF THOSE WHO INDICATE EMPLOYEES AT THEIR FIRM DO NOT RECEIVE
TRAINING, 77% WOULD LIKE THEM TO – WITH MISCELLANEOUS SOURCES BEING
THE MOST PREFERRED MODE, FOLLOWED BY ONLINE STRUCTURE TRAINING.
If you would like employees at your firm to receive training in
considering ESG issues, what would be your preferred mode?
TOTAL
AMER
APAC
EMEA
37%
32%
30%
30%
27%
26%
25%
23%
22%
20%
19%
16%
16%
13% 12%
14%
12%
10%
9%
2% 3%
Miscellaneous sources
(research papers,
books, conferences)
N=656
Online structured
training
Learning by doing, it’s
an art
Live, in-person
structured training
course
1% 1%
Other
0%
None of these, I do not
think training in
considering ESG issues
necessary
13
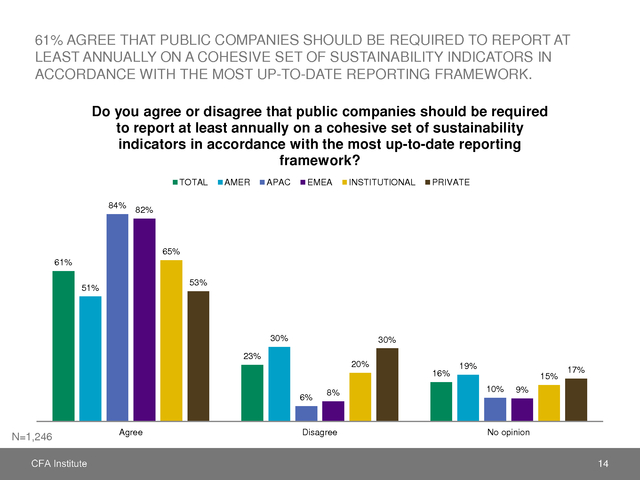
�. 61% AGREE THAT PUBLIC COMPANIES SHOULD BE REQUIRED TO REPORT AT
LEAST ANNUALLY ON A COHESIVE SET OF SUSTAINABILITY INDICATORS IN
ACCORDANCE WITH THE MOST UP-TO-DATE REPORTING FRAMEWORK.
Do you agree or disagree that public companies should be required
to report at least annually on a cohesive set of sustainability
indicators in accordance with the most up-to-date reporting
framework?
TOTAL
84%
AMER
APAC
EMEA
INSTITUTIONAL
PRIVATE
82%
65%
61%
53%
51%
30%
30%
23%
20%
16%
6%
N=1,246
Agree
8%
Disagree
19%
15%
10%
17%
9%
No opinion
14
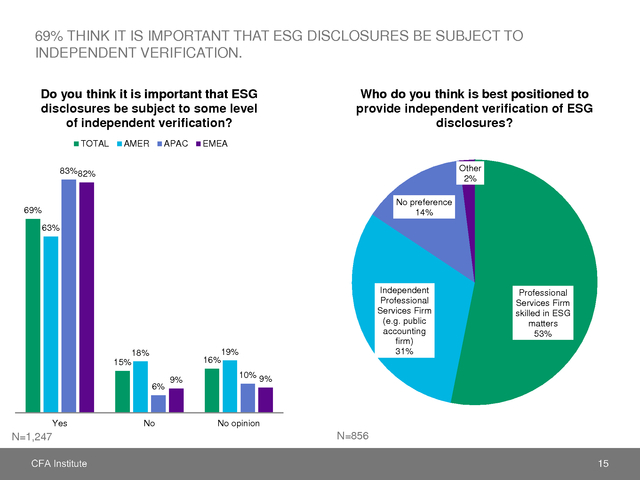
�. 69% THINK IT IS IMPORTANT THAT ESG DISCLOSURES BE SUBJECT TO
INDEPENDENT VERIFICATION.
Do you think it is important that ESG
disclosures be subject to some level
of independent verification?
TOTAL
AMER
APAC
Who do you think is best positioned to
provide independent verification of ESG
disclosures?
EMEA
Other
2%
83%82%
No preference
14%
69%
63%
18%
16%
15%
6%
Yes
N=1,247
No
9%
Independent
Professional
Services Firm
(e.g. public
accounting
firm)
31%
19%
Professional
Services Firm
skilled in ESG
matters
53%
10% 9%
No opinion
N=856
15
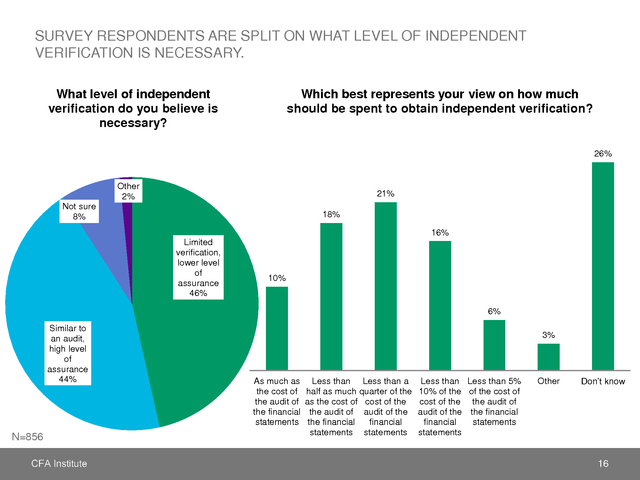
�. SURVEY RESPONDENTS ARE SPLIT ON WHAT LEVEL OF INDEPENDENT
VERIFICATION IS NECESSARY.
What level of independent
verification do you believe is
necessary?
Which best represents your view on how much
should be spent to obtain independent verification?
26%
Other
2%
21%
Not sure
8%
18%
16%
Limited
verification,
lower level
of
assurance
46%
10%
6%
Similar to
an audit,
high level
of
assurance
44%
N=856
3%
As much as
the cost of
the audit of
the financial
statements
Less than Less than a
half as much quarter of the
as the cost of cost of the
the audit of audit of the
the financial
financial
statements statements
Less than Less than 5%
10% of the of the cost of
cost of the the audit of
audit of the the financial
financial
statements
statements
Other
Don’t know
16
�. RESPONDENT PROFILE
17
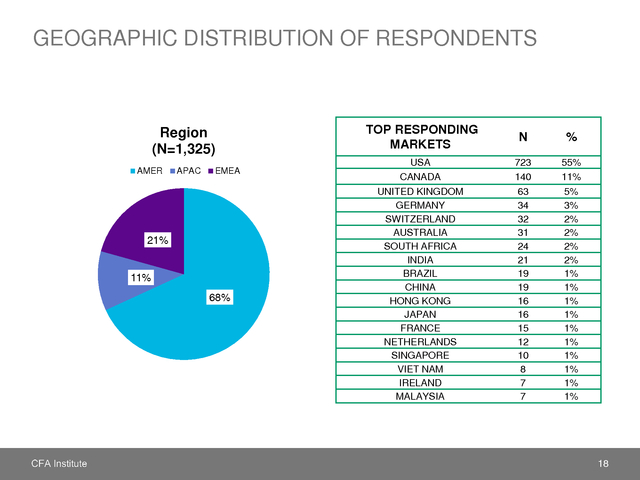
�. GEOGRAPHIC DISTRIBUTION OF RESPONDENTS
Region
(N=1,325)
AMER
APAC
EMEA
21%
11%
68%
TOP RESPONDING
MARKETS
N
%
USA
CANADA
723
140
55%
11%
UNITED KINGDOM
GERMANY
SWITZERLAND
AUSTRALIA
SOUTH AFRICA
INDIA
BRAZIL
CHINA
HONG KONG
JAPAN
FRANCE
NETHERLANDS
SINGAPORE
VIET NAM
IRELAND
MALAYSIA
63
34
32
31
24
21
19
19
16
16
15
12
10
8
7
7
5%
3%
2%
2%
2%
2%
1%
1%
1%
1%
1%
1%
1%
1%
1%
1%
18
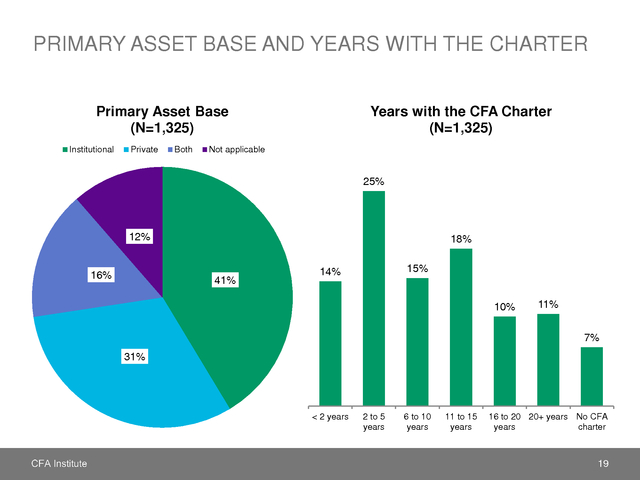
�. PRIMARY ASSET BASE AND YEARS WITH THE CHARTER
Primary Asset Base
(N=1,325)
Institutional
Private
Both
Years with the CFA Charter
(N=1,325)
Not applicable
25%
12%
16%
18%
41%
15%
14%
10%
11%
7%
31%
< 2 years
2 to 5
years
6 to 10
years
11 to 15
years
16 to 20 20+ years No CFA
years
charter
19
�.