Fixed Income Services
March 14, 2016
Municipal Bond Investor Weekly
Ted Ruddock - SVP, Head of High Net Worth
Drew O’Neil - Fixed Income Strategist
“Who’s who of dot plots…” Yes, it’s going to be one of those weeks: another FOMC meeting with all sorts of “experts” expounding
with seemingly high degrees of certainly on what will happen this week and what’s to come in the weeks and months ahead. If there
is any doubt that the focus of many market participants has shifted to speculation from long-term investing, one only has to look no
further than the famous “dot plots” of the FOMC. Investment houses are happy to state the odds and timing of a certain rate move;
in London, odds-makers will gladly take your personal bets. Back home, there are some who believe they have deciphered the dot
plots: they “know” who is who (or in this case, which) dot.
Amazing. And I missed my golden opportunity to unlock the mystery as I
found myself standing next to Chairman Bernanke in Washington DC over the weekend at the most unlikely of places: the conclusion
of the Rock & Roll ½ Marathon. (No, the former Chairman was not a runner, but rather supporting a family member.) Had I asked, I
just might have extracted a smile from him at the silliness of it all.
And yet, this is what clients are faced with these days: an overabundance of market noise.
And a dearth of clarity. Except when it
comes to investing in investment grade municipal bonds. How so? There are few investment options where so much is known before
you invest.
There’s no guessing, certainly no speculating. You know what your semi-annual coupon cash flow will be. You know what
day you get your money back.
You know that you will get your money back --- with a degree of certainty that exceeds 99%. With that
level of clarity, there is little to decipher. Is it any wonder this is where clients want to put their safe money?
Granted, yields aren’t what they used to be “in the good old days.” The search for 5s at par is a long lost memory.
But then again,
inflation isn’t what it used to be either. And when much of the world is adjusting to negative interest rates, municipal bonds offer
extremely attractive risk adjusted and tax-equivalent yields. (See our weekly table below on just how attractive rates are.) For longterm, buy and hold investors, while 5s at par may be long gone, “5s at par” are possible on a tax-adjusted basis --- it’s just a 3 at par
for an investor in the highest federal tax bracket! And there are plenty of 3s at par out there --- dots plotted along the curves --credit and term.
The Week ahead… “March Madness” continues with Vanderbilt leading the way…no I’m not referring to the highly emotional
bubble bid by the Commodores following their heartbreaking loss to Tennessee over the weekend.
This week the Vanderbilt
University Medical Center will come to market with the top seeded issue, a $780 million offering through the Metropolitan
Government of Nashville and Davidson County. The deal, which is expected to include a $530 million tax-exempt portion and $250
million in taxable, will be rated A3 by Moody’s. NYTFA has the #2 seed with a $750 million transaction rated Aa2/AA/AA.
Connecticut
will round out the top three with a $550 million GO issue (Aa2/AA/AA --- all three rating agencies have a negative outlook.) (The
UConn Huskies outlook, however, is positive, as it won its division title and a # 9 seeding following a miraculous, four OTs, semi-final
win over Cincinnati in the American Athletic Conference tournament. If you somehow missed the shot, check out You-Tube!) See
below for additional issues in what is expected to be a $7+ billion week in the market. Let the Madness begin!!
And now for the numbers… Treasury rates were down early in the week before bouncing back to into positive territory as the week
came to a close.
Yields were down ~10 basis points by Tuesday afternoon before beginning a steady rise through the end of the
week, finishing up 10 bp at 10-years and up 5 bp at 5-years. Municipal yields took a similar path early in the week, but without the
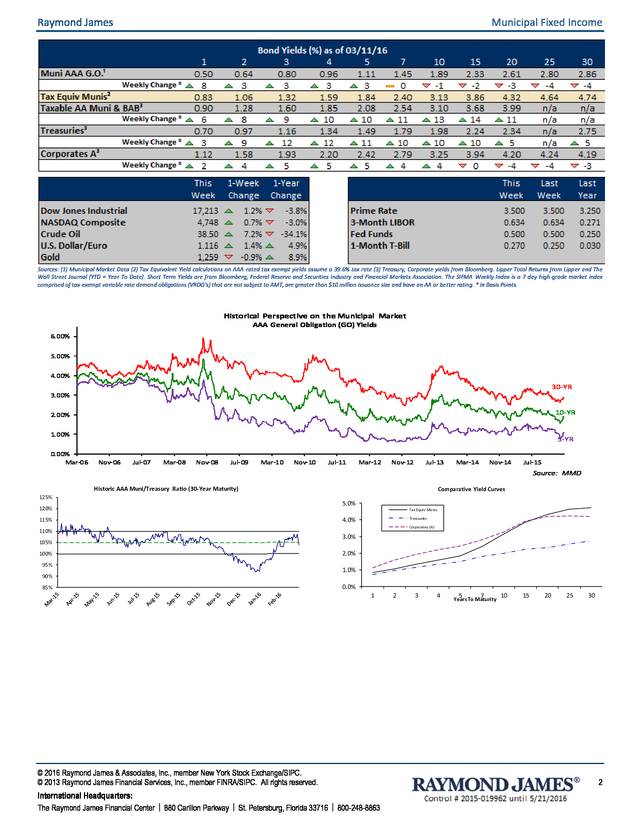
bounce-back we saw in Treasuries. For the week, the 10-year MMD yield was down 1 bp while the 30-year ended down 4 bp.
This
combination of moves resulted in a drop in the muni-Treasury ratios, as can be seen in the chart below.
This Week
10 Y
Muni MMD
1.89%
Treasury
1.98%
Ratio
95.5
Tax Equivalent Ratio (Fed 39.6%)
158.0
30 Y
2.86%
2.75%
104.0
172.2
Last Week
10 Y
1.90%
1.88%
101.1
167.3
30 Y
2.90%
2.70%
107.4
177.8
© 2016 Raymond James & Associates, Inc., member New York Stock Exchange/SIPC.
© 2014 Raymond James Financial Services, Inc., member FINRA/SIPC. All rights reserved.
International Headquarters:
The Raymond James Financial Center | 880 Carillon Parkway | St. Petersburg, Florida 33716 | 800-248-8863
Change
10 Y
-0.01%
0.10%
-5.6
-9.3
30 Y
-0.04%
0.05%
-3.4
-5.6
1
�.
Raymond James
Municipal Fixed Income
Sources: (1) Municipal Market Data (2) Tax Equivalent Yield calculations on AAA-rated tax exempt yields assume a 39.6% tax rate (3) Treasury, Corporate yields from Bloomberg. Lipper Total Returns from Lipper and The
Wall Street Journal (YTD = Year To Date). Short Term Yields are from Bloomberg, Federal Reserve and Securities Industry and Financial Markets Association. The SIFMA Weekly Index is a 7-day high-grade market index
comprised of tax-exempt variable rate demand obligations (VRDO's) that are not subject to AMT, are greater than $10 million issuance size and have an AA or better rating.
* In Basis Points.
Historical Perspective on the Municipal Market
AAA General Obligation (GO) Yields
6.00%
5.00%
4.00%
30-YR
3.00%
10-YR
2.00%
1.00%
0.00%
Mar-06
5-YR
Nov-06
Jul-07
Mar-08
Nov-08
Jul-09
Mar-10
Nov-10
Jul-11
Mar-12
Nov-12
Jul-13
Mar-14
Nov-14
Jul-15
Source: MMD
Historic AAA Muni/Treasury Ratio (30-Year Maturity)
125%
120%
115%
110%
105%
100%
95%
90%
85%
Comparative Yield Curves
5.0%
Tax Equiv Mu nis
Treasuries
4.0%
Corporates (A)
3.0%
2.0%
1.0%
0.0%
1
© 2016 Raymond James & Associates, Inc., member New York Stock Exchange/SIPC.
© 2013 Raymond James Financial Services, Inc., member FINRA/SIPC. All rights reserved.
International Headquarters:
The Raymond James Financial Center | 880 Carillon Parkway | St. Petersburg, Florida 33716 | 800-248-8863
2
3
4
5
7
Years To Maturity
10
15
20
25
30
2
�.
Raymond James
Municipal Fixed Income
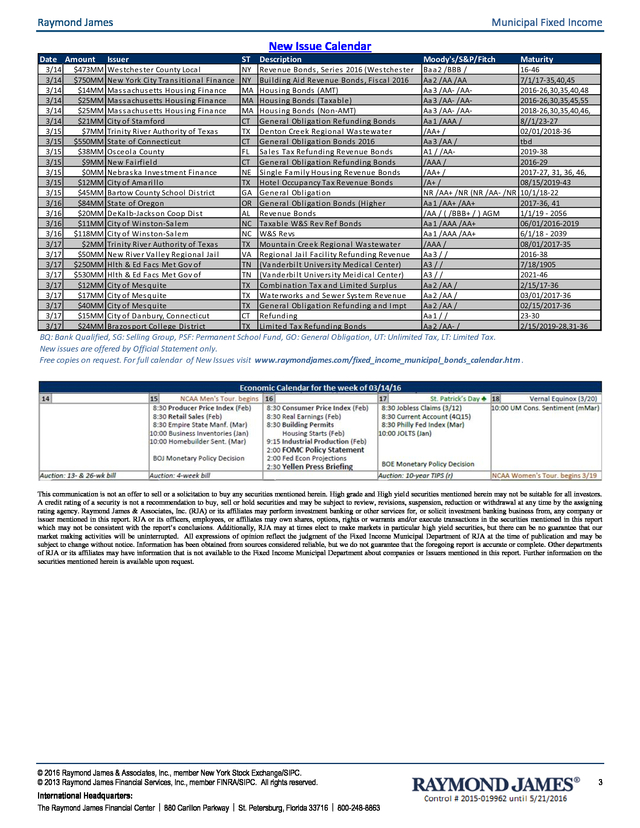
New Issue Calendar
Date Amount
3/14
3/14
3/14
3/14
3/14
3/14
3/15
3/15
3/15
3/15
3/15
3/15
3/15
3/16
3/16
3/16
3/16
3/17
3/17
3/17
3/17
3/17
3/17
3/17
3/17
3/17
$473MM
$750MM
$14MM
$25MM
$25MM
$21MM
$7MM
$550MM
$38MM
$9MM
$0MM
$12MM
$45MM
$84MM
$20MM
$11MM
$118MM
$2MM
$50MM
$250MM
$530MM
$12MM
$17MM
$40MM
$15MM
$24MM
Issuer
ST
Description
Moody's/S&P/Fitch
Maturity
Wes tches ter County Loca l
New York Ci ty Tra ns i tiona l Fi na nce
Ma s s a chus etts Hous i ng Fi na nce
Ma s s a chus etts Hous i ng Fi na nce
Ma s s a chus etts Hous i ng Fi na nce
Ci ty of Stamford
Tri ni ty Ri ver Authori ty of Texa s
State of Connecticut
Os ceol a County
New Fa i rfi el d
Nebra s ka Inves tment Fi na nce
Ci ty of Ama ri l l o
Ba rtow County School Di s tri ct
State of Oregon
DeKa l b-Ja cks on Coop Di s t
Ci ty of Wi ns ton-Sa l em
Ci ty of Wi ns ton-Sa l em
Tri ni ty Ri ver Authori ty of Texa s
New Ri ver Va l l ey Regi ona l Ja i l
Hl th & Ed Fa cs Met Gov of
Hl th & Ed Fa cs Met Gov of
Ci ty of Mes qui te
Ci ty of Mes qui te
Ci ty of Mes qui te
Ci ty of Da nbury, Connecticut
Bra zos port Col l ege Di s tri ct
NY
NY
MA
MA
MA
CT
TX
CT
FL
CT
NE
TX
GA
OR
AL
NC
NC
TX
VA
TN
TN
TX
TX
TX
CT
TX
Revenue Bonds , Seri es 2016 (Wes tches ter
Bui l di ng Ai d Revenue Bonds , Fi s ca l 2016
Hous i ng Bonds (AMT)
Hous i ng Bonds (Ta xa bl e)
Hous i ng Bonds (Non-AMT)
Genera l Obl i ga tion Refundi ng Bonds
Denton Creek Regi ona l Wa s tewa ter
Genera l Obl i ga tion Bonds 2016
Sa l es Ta x Refundi ng Revenue Bonds
Genera l Obl i ga tion Refundi ng Bonds
Si ngl e Fa mi l y Hous i ng Revenue Bonds
Hotel Occupa ncy Ta x Revenue Bonds
Genera l Obl i ga tion
Genera l Obl i ga tion Bonds (Hi gher
Revenue Bonds
Ta xa bl e W&S Rev Ref Bonds
W&S Revs
Mountai n Creek Regi ona l Wa s tewa ter
Regi ona l Ja i l Fa ci l i ty Refundi ng Revenue
(Va nderbi l t Uni vers i ty Medi ca l Center)
(Va nderbi l t Uni vers i ty Mei di ca l Center)
Combi na tion Ta x a nd Li mi ted Surpl us
Wa terworks a nd Sewer Sys tem Revenue
Genera l Obl i ga tion Refundi ng a nd Impt
Refundi ng
Li mi ted Ta x Refundi ng Bonds
Ba a 2 /BBB /
Aa 2 /AA /AA
Aa 3 /AA- /AAAa 3 /AA- /AAAa 3 /AA- /AAAa 1 /AAA /
/AA+ /
Aa 3 /AA /
A1 / /AA/AAA /
/AA+ /
/A+ /
NR /AA+ /NR (NR /AA- /NR
Aa 1 /AA+ /AA+
/AA / ( /BBB+ / ) AGM
Aa 1 /AAA /AA+
Aa 1 /AAA /AA+
/AAA /
Aa 3 / /
A3 / /
A3 / /
Aa 2 /AA /
Aa 2 /AA /
Aa 2 /AA /
Aa 1 / /
Aa 2 /AA- /
16-46
7/1/17-35,40,45
2016-26,30,35,40,48
2016-26,30,35,45,55
2018-26,30,35,40,46,
8//1/23-27
02/01/2018-36
tbd
2019-38
2016-29
2017-27, 31, 36, 46,
08/15/2019-43
10/1/18-22
2017-36, 41
1/1/19 - 2056
06/01/2016-2019
6/1/18 - 2039
08/01/2017-35
2016-38
7/18/1905
2021-46
2/15/17-36
03/01/2017-36
02/15/2017-36
23-30
2/15/2019-28,31-36
BQ: Bank Qualified, SG: Selling Group, PSF: Permanent School Fund, GO: General Obligation, UT: Unlimited Tax, LT: Limited Tax.
New issues are offered by Official Statement only.
Free copies on request. For full calendar of New Issues visit www.raymondjames.com/fixed_income_municipal_bonds_calendar.htm .
This communication is not an offer to sell or a solicitation to buy any securities mentioned herein. High grade and High yield securities mentioned herein may not be suitable for all investors.
A credit rating of a security is not a recommendation to buy, sell or hold securities and may be subject to review, revisions, suspension, reduction or withdrawal at any time by the assigning
rating agency. Raymond James & Associates, Inc.
(RJA) or its affiliates may perform investment banking or other services for, or solicit investment banking business from, any company or
issuer mentioned in this report. RJA or its officers, employees, or affiliates may own shares, options, rights or warrants and/or execute transactions in the securities mentioned in this report
which may not be consistent with the report’s conclusions. Additionally, RJA may at times elect to make markets in particular high yield securities, but there can be no guarantee that our
market making activities will be uninterrupted.
All expressions of opinion reflect the judgment of the Fixed Income Municipal Department of RJA at the time of publication and may be
subject to change without notice. Information has been obtained from sources considered reliable, but we do not guarantee that the foregoing report is accurate or complete. Other departments
of RJA or its affiliates may have information that is not available to the Fixed Income Municipal Department about companies or Issuers mentioned in this report.
Further information on the
securities mentioned herein is available upon request.
© 2016 Raymond James & Associates, Inc., member New York Stock Exchange/SIPC.
© 2013 Raymond James Financial Services, Inc., member FINRA/SIPC. All rights reserved.
International Headquarters:
The Raymond James Financial Center | 880 Carillon Parkway | St. Petersburg, Florida 33716 | 800-248-8863
3
�.